Transport
Transport
2/2/18
What you can do: –
- Encourage Councils, business associates, friends to change from petrol and diesel cars to electric
- Encourage increase in charging points
- Restrictions on flying
- Encourage sensible speeds for trains, boats and ferries
Vehicle travel is heavily dependent on fossil fuels. Since we must in future phase out fossil fuel use, this sector is likely to be the most difficult to make carbon free. Restrictions in travel are likely.
The CO2 emissions from Uk domestic transport and international shipping and aviation are shown in table 1. Road transport accounts for almost 70% of the total transport emissions. Apart from light vans, where emissions have increased by 55% since 1990, emissions have stayed relatively constant over the 25-year period. This may be due to more efficient engines compensating for increased traffic. What is obvious is that cars have either to become battery powered electric or be used less, if transport emissions are to be reduced.
Table 1. Emissions (M tonne CO2 equivalent per annum) from UK domestic and international transport for 1990-2015
| Transport type | Year | 2015 | |||||
| 1990 | 1995 | 2000 | 2005 | 2010 | 2015 | % | |
| Cars & taxis | 72.3 | 73.2 | 77.0 | 77.4 | 70.2 | 69.1 | 43.0 |
| HG Vehicles | 20.5 | 19.9 | 19.5 | 20.8 | 18.6 | 19.6 | 12.2 |
| Light vans | 11.6 | 12.9 | 14.3 | 15.8 | 16.1 | 18.0 | 11.2 |
| Busses & coaches | 5.3 | 5.4 | 4.9 | 4.6 | 4.3 | 3.7 | 2.3 |
| Other road transport | 1.0 | 0.7 | 0.9 | 1.3 | 1.2 | 1.0 | 0.6 |
| Road, sub total | 110.6 | 112.1 | 116.6 | 119.9 | 110.3 | 111.5 | 69.4 |
| Rail | 2.0 | 2.0 | 2.2 | 1.9 | 2.0 | 1.9 | 1.2 |
| Domestic aviation | 1.5 | 1.4 | 2.1 | 2.6 | 1.8 | 1.5 | 0.9 |
| Domestic shipping | 2.3 | 2.5 | 2.5 | 2.7 | 2.6 | 2.5 | 1.6 |
| Other | 5.6 | 4.2 | 3.3 | 3.4 | 3.4 | 2.6 | 1.6 |
| Rail, domestic aviation/shipping, sub total | 11.3 | 10.1 | 10.1 | 10.5 | 9.8 | 8.5 | 5.3 |
| Sub total domestic | 121.9 | 122.2 | 126.7 | 130.4 | 120.1 | 120.0 | 74.7 |
| International aviation | 15.4 | 20.0 | 30.1 | 35.0 | 31.6 | 33.3 | 20.7 |
| International shipping | 8.7 | 8.1 | 6.7 | 7.7 | 9.0 | 7.4 | 4.6 |
| Total domestic & international | 146.0 | 150.3 | 163.5 | 173.1 | 160.7 | 160.7 | 100 |
Ref: Transport Statistics Great Britain. UK Government report. November 2017
International aviation has increased by 116 % between 1990 and 2015. It is now 21% of emissions from the transport sector. As far as I can make out, these emissions do not include the almost threefold global warming effect of emitting CO2 at altitude. Since aviation is at present very dependent on liquid fuels, limits on air travel would seem to be inevitable if the 2015 Paris Accord limits are to be met.
Road transport
At 70 % of transport CO2 emissions, the present usage and vehicle types must change. For cars, light vans and town busses a move to electric vehicles seems like a “get out of jail free” solution. People can continue to travel as before, but by using stored renewable electrical energy instead of carbon-based fuels. HG vehicles and long-distance coaches pose a more difficult problem but may eventually have to change to hydrogen made from renewables. A move from road to electrified rail is probably a more efficient alternative.
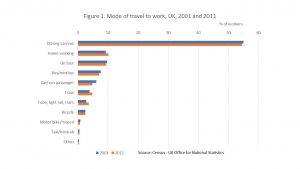
People predominantly travel to  work by car (See Fig 1, click to enlarge). A change in behaviour to walking, cycling and public would not only do wonders for their health, but would reduce car use and congestion. The average commuter does 1,266 miles per person per annum, usually on their own (Personal travel factsheet, community and business travel, DOT, April 2011). Commuting accounts for 15% of all their trips using their car.
Aviation
The breakthrough in low cost air travel has been wonderful for holiday travellers, travel companies and businesses but a disaster for the planet. International aviation CO2 emissions increased from 10.5% of total UK transport emissions in 1990 to 21% in 2015. The climate change impact of these emissions is probably greater, due to these being emitted at altitude., this increase from 10.5 % of total transport emissions in 1990 is a serious change. Not only does this have a serious impact on global warming, but there is not an easy solution to reducing its carbon fuel base.
Bikes and walking
Travel by bike and by walking obviously have the lowest emissions. While the UK’s pavement infrastructure is good, that for bikes is not. A look at the continent shows what can be done.


